

The Office Markets Turning Point: Leasings Up, Buildings Down
The Office Markets Turning Point is Happening Now
A SpaceWerx Whitepaper | Blog Edition
Executive Summary
For several years, the office sector has absorbed more skepticism than any other real estate asset class. Vacancy headlines, hybrid-work debates, and obsolescence narratives have shaped the discussion. However, national data now tells a more nuanced story — one of quiet recalibration rather than collapse.
Leasing is recovering. Vacancy is tightening in several major markets. At the same time, new development has virtually stopped, and meaningful office inventory is being permanently removed through conversions and demolitions. This divergence may materially shape the next cycle.
Leasing Is Recovering
Leasing of available, quality and highly-amenitized space continues to rise.
2025 National Vacancy- 16.2% (Lowest since Q2 2023)
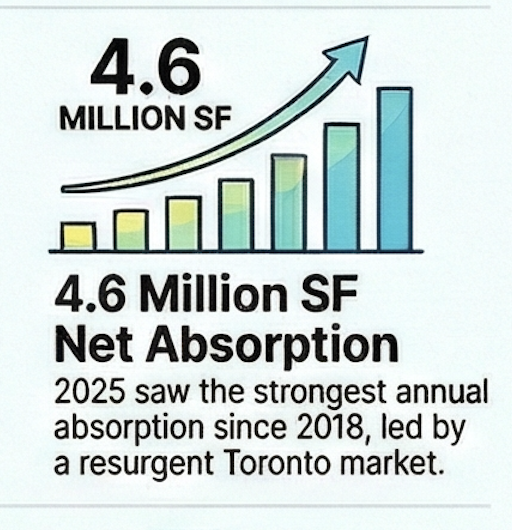
Annual Net Absorption- 4.6M SF (Strongest since 2018)
Consecutive Positive Years- 2 Years
Toronto Absorption- 2.7M SF (Primarily Downtown)
Class A Vacancy- Three-Year Low
Sublease - Decline
3.2M SF (Back to 2017 Levels)
Capital Is Not Following Leasing
Historically, tightening vacancy and improving absorption triggered institutional investment and new development. That pattern has stalled. Even as leasing stabilizes, capital remains cautious due to interest rates, lender conservatism, valuation resets, and elevated vacancy optics.
Since 2020, capital has largely favored multi-residential development. Across major markets, new apartment cranes are common — office cranes are not.
The Development Pipeline Has Reached Historic Lows
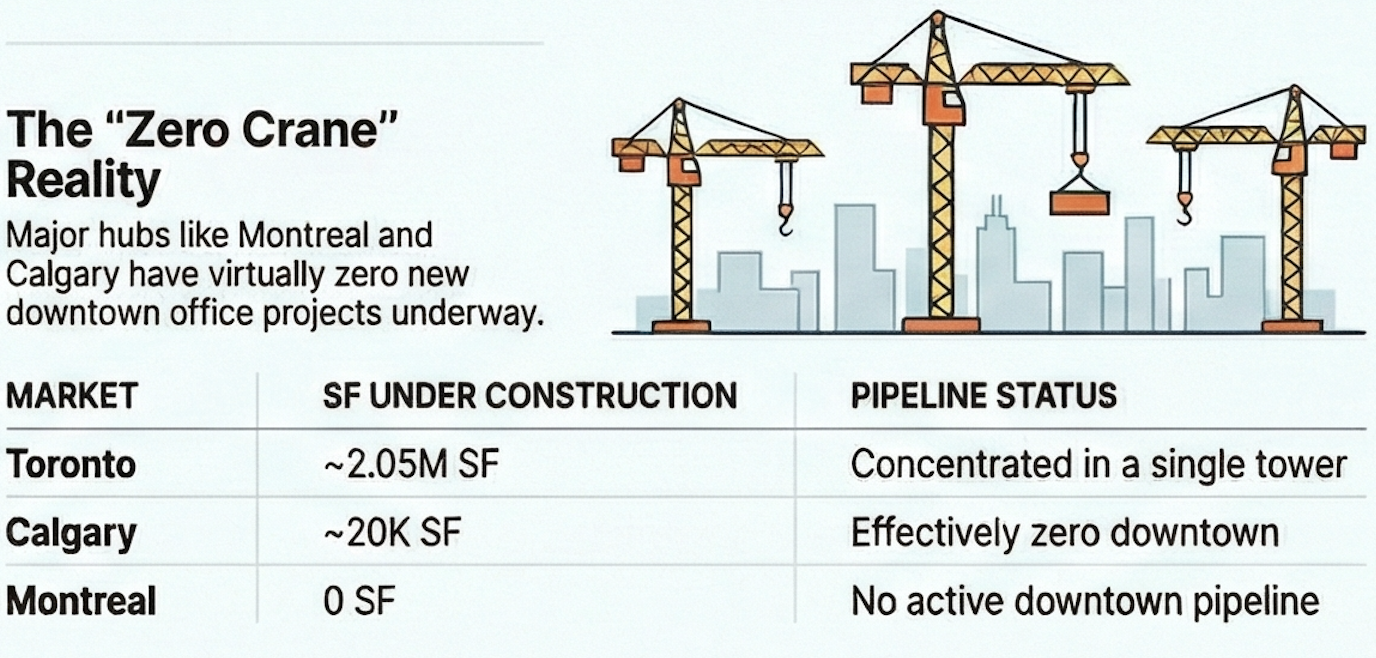
Little or no construction activity happening in most markets.
Metrics
Value Under Construction- 2.8–3.3M SF
Share of National Inventory- ~0.5%
2025 Deliveries- 0.67–1.25M SF
Pre-Leased Pipeline- ~69%
Meaningful Supply Beyond 2026- Minimal
Major Market Snapshot
Markets Under Construction
Toronto- ~2.05M SF (Concentrated in one major tower; highly pre-leased)
Vancouver- ~0.6M SF (Mostly suburban)
Calgary- ~20K SF (Essentially no downtown product underway)
Ottawa- ~36K SF (Minimal activity)
Montreal- 0 SF (No active downtown pipeline)
Halifax- ~80K SF (Small-scale suburban projects)
Meanwhile — Inventory Is Shrinking
Conversions, Demolition and no new development.
7.8 million SF removed through conversions
2.6 million SF removed through demolitions
Total inventory reduction: 2.2% since 2021
Calgary accounts for nearly half of all converted product
The Big Question
If modestly positive absorption continues, sublease space declines, Class A vacancy tightens, and development remains constrained through 2028, the supply picture in 2029–2032 could look dramatically different.
We do not need a return to 2019 occupancy to create pressure — only incremental demand against a constrained supply base. The data suggests we may be underbuilding for the next cycle.
Strategic Implications
For Investors
Prime, well-located, ESG-forward assets may face limited new competition later this decade.
For Tenants
Today’s leverage may narrow as premium supply tightens and expansion options shrink.
For Developers
The risk is no longer building into vacancy — it is missing the next tightening phase.
Closing Thought
Are we stabilizing or quietly setting up the next supply squeeze? The next decade may provide the answer.
SpaceWerx | Imagine. Plan. Create.
www.spacewerx.ca